
Analytics
“Product management is about saying ‘no’ to 1,000 things so that you can say ‘yes’ to the one that matters.”
– Steve Jobs
Welcome to Day 15 of the PM series – Product Management in 30 days!
In today’s data-driven world, product management is evolving rapidly. Product managers are no longer just responsible for ideation and development but also for understanding user behaviour, making data-informed decisions, and optimizing product performance. This transformation is made possible by leveraging the power of product analytics, metrics, and data analytics.
In this extensive article, we will delve into the world of product analytics, exploring various types of metrics, the techniques to gather and analyze data, what makes a metric “good,” popular frameworks, recommended books, and a comprehensive list of the top 20 product metrics categorized for easy reference. Real-world examples will be interwoven to illustrate concepts throughout.
Learning Objectives
- Understanding Product Analytics: Define the concept of product analytics and its role in product management, elucidating how it involves collecting, analyzing, and interpreting data related to a product’s usage and performance.
- Grasping Types of Product Metrics: Differentiate between quantitative and qualitative product metrics, recognizing their importance in guiding product managers. Identify key metrics categories, including user acquisition, engagement, retention, revenue, and customer support.
- Mastering Data Analytics Techniques: Explore effective techniques for data analytics, covering data collection and storage, various data analysis approaches (descriptive, predictive, prescriptive), and the importance of data visualization using tools like Tableau and Power BI.
- Criteria for Good Metrics: Understand the characteristics that distinguish good metrics, including relevance, actionability, consistency, and the importance of considering the broader context in which metrics operate.
- Frameworks for Product Analytics: Familiarize yourself with prominent frameworks such as AARRR (Pirate Metrics) and the HEART framework. Comprehend how these frameworks provide structured approaches to analyzing various stages of the customer lifecycle and evaluating user experience.
📈 Defining Product Analytics and Metrics:
Product analytics involves collecting, analysing, and interpreting data related to a product’s usage and performance. Conversely, metrics are quantifiable measures that provide specific information about a product’s health, user engagement, and financial performance.
📊 Types of Product Metrics
Metrics are the compass that guides product managers. They come in various flavours, each serving a unique purpose.
📌 Quantitative Metrics
- User Acquisition Metrics: Measure how users discover your product.
- User Engagement Metrics: Track user interactions and engagement within your product.
- Retention Metrics: Assess user loyalty and long-term usage.
- Revenue Metrics: Gauge the financial health of your product.
- Customer Support Metrics: Evaluate user satisfaction and support effectiveness.
📌 Qualitative Metrics
- Customer Feedback Metrics: Analyze customer feedback and sentiments.
- Usability Metrics: Evaluate the ease of use and user experience.
- Net Promoter Score (NPS): Measure customer loyalty and advocacy.
- Customer Satisfaction (CSAT): Assess overall customer satisfaction.
🤖 Techniques for Effective Data Analytics
Data analytics is the art of transforming raw data into actionable insights.
1️⃣ Data Collection and Storage
- Data Sources: Identify and gather data from various sources, including user interactions, surveys, and third-party tools.
- Data Warehousing: Store and organize data efficiently for analysis.
2️⃣ Data Analysis Techniques
- Descriptive Analytics: Summarize data to understand historical trends.
- Predictive Analytics: Use data to make predictions about future trends.
- Prescriptive Analytics: Recommend actions based on data insights.
3️⃣ Data Visualization
- Dashboards: Create informative dashboards for real-time monitoring.
- Visualization Tools: Leverage tools like Tableau, Power BI, or Google Studio.
✅ What Makes Good Metrics?
Not all metrics are created equal. Effective metrics share specific characteristics.
- Relevance: Metrics should align with your product’s goals and objectives.
- Actionability: They should provide insights that lead to actionable decisions.
- Consistency: Metrics should be consistently measurable over time.
- Context: Always consider the broader context in which metrics operate.
🖼️ Frameworks for Product Analytics
Many frameworks are available for product metrics; however, the industry defacto standards are below two.
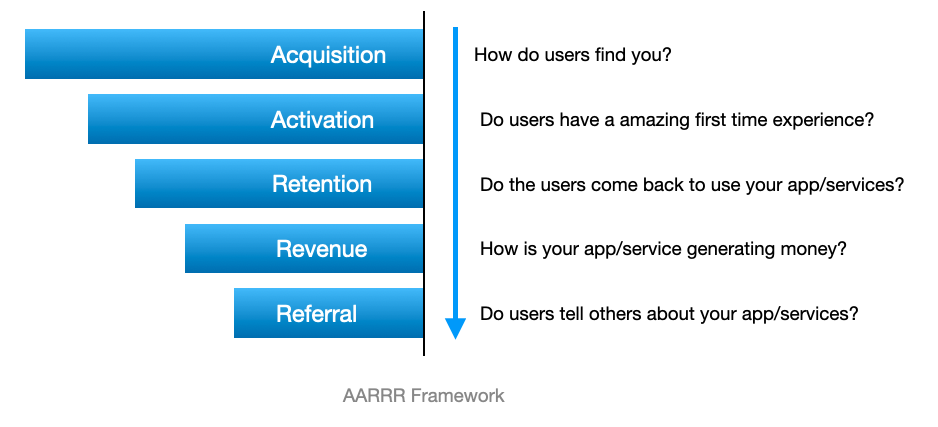
➡️ AARRR (Pirate Metrics)
AARRR, often referred to as Pirate Metrics, is a framework used to analyze and optimize various stages of the customer lifecycle in a business. The acronym AARRR stands for Acquisition, Activation, Retention, Revenue, and Referral. This framework was popularized by Dave McClure, a venture capitalist and entrepreneur. Let’s delve into each stage with an example:
1️⃣ Acquisition:
- Definition: Acquisition focuses on getting users to visit and engage with your product or service. It measures how effectively you attract and bring in new users.
- Example: If you run a mobile app, acquisition metrics might include the number of downloads, website visits, or sign-ups. For an e-commerce website, acquisition metrics may involve tracking the number of new visitors coming from various marketing channels, such as social media, search engines, or email campaigns.
2️⃣ Activation:
- Definition: Activation is about turning newly acquired users into active users by providing a positive first experience. It measures the percentage of users who take a specific action, indicating initial engagement.
- Example: For a software product, activation could be measured by the percentage of users who complete their profile setup or perform a key action within the first few minutes of using the application. In the case of an online service, activation metrics might include the percentage of trial users who complete a meaningful interaction during their trial period.
3️⃣ Retention:
- Definition: Retention assesses the ability of your product or service to keep users coming back and engaging over time. It measures the percentage of users who continue to use your product.
- Example: In a subscription-based business model, retention is often measured by the percentage of customers who renew their subscription after the initial period. For a mobile app, retention might be tracked by the number of users who return to the app within a specific time frame after their initial visit.
4️⃣ Revenue:
- Definition: Revenue measures the financial success of your business. It involves converting active users into paying customers and maximizing the value they bring to your business.
- Example: For an e-commerce platform, revenue metrics include the average order value, total sales, and customer lifetime value. In a SaaS business, revenue is often tied to subscription fees, upsells, or other monetization strategies.
5️⃣ Referral:
- Definition: Referral evaluates the ability of your product to turn satisfied customers into advocates who refer others. It measures the growth generated through word-of-mouth and customer referrals.
- Example: Referral metrics might include the number of customers who refer friends, the success of referral programs, or the increase in user sign-ups resulting from word-of-mouth marketing. Referral is crucial for organic growth and expanding the user base.
Example Scenario:
Imagine you have a mobile app for language learning. Here’s how AARRR might apply:
| Strategies | Goal | Strategies | Metrics |
| Acquisition | Increase app downloads and installations. | Online marketing, partnerships, social media promotions. | Downloads: 100,000, Installations from Partnerships: 30,000. |
| Activation | Encourage users to complete onboarding and explore features. | Streamlined onboarding, personalized content recommendations. | Onboarding Completion Rate: 80%, Features Explored: 5. |
| Retention | Retain users over time with engaging content and positive experience. | Personalized content, diverse content library. | 7-day Retention Rate: 70%, 30-day Retention Rate: 50%, Avg. Sessions per User per Week: 3. |
| Revenue | Generate revenue through subscriptions, in-app purchases, or ads. | Subscription tiers, in-app purchases, ad-supported version. | Revenue per User: $5, Conversion Rate for Premium Subscriptions: 15%. |
| Referral | Encourage users to refer the app, expanding the user base. | Incentivized referral programs, social media sharing. | Number of Referrals: 2,000, Conversion Rate of Referred Users: 20%. |
Why AARRR Matters?
- Comprehensive View: AARRR provides a holistic view of the customer lifecycle, from acquisition to revenue generation and beyond.
- Data-Driven Decision-Making: By tracking specific metrics at each stage, businesses can make informed decisions to optimize their strategies.
- Identifying Weak Points: AARRR helps identify weaknesses in the customer journey, allowing businesses to focus on areas that need improvement.
- Continuous Improvement: The framework supports a cycle of continuous improvement, where businesses refine their approach based on ongoing analysis and feedback.
➡️ HEART Framework
The HEART framework is a user experience (UX) evaluation framework developed by Google, designed to measure the quality of user experience in terms of key aspects such as Happiness, Engagement, Adoption, Retention, and Task Success. The framework provides a structured approach to defining and measuring UX metrics, helping teams make data-driven decisions to improve the user experience.
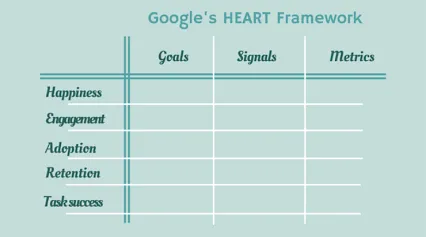
Author/Copyright holder: Google Inc. Copyright terms and licence: All rights reserved
The components of the HEART framework are:
1️⃣ Happiness:
- Goal: Measure the overall satisfaction and enjoyment of users with the product or service.
- Signals: Include user ratings, surveys, and sentiment analysis.
- Metrics: Net Promoter Score (NPS), Customer Satisfaction (CSAT), User Ratings.
2️⃣ Engagement:
- Goal: Assess the level of user engagement and interaction with the product.
- Signals: Frequency of use, time spent on the platform, interactions per session.
- Metrics: Daily Active Users (DAU), Weekly Active Users (WAU), Monthly Active Users (MAU), Session Duration.
3️⃣ Adoption:
- Goal: Measure how well users are adopting and integrating the product into their routines.
- Signals: New user sign-ups, onboarding completion rates.
- Metrics: Number of new accounts, Conversion Rate from sign-up to active usage.
4️⃣ Retention:
- Goal: Evaluate how many users continue to use the product over time.
- Signals: Churn rate, user retention rate.
- Metrics: 1-day retention, 7-day retention, 30-day retention.
5️⃣ Task Success:
- Goal: Assess the efficiency and effectiveness of users in completing specific tasks.
- Signals: Task completion rates, error rates, time to complete tasks.
- Metrics: Task success rate, Error rate, Time to task completion.
Example:
Let’s consider an example of a mobile app that offers language learning courses.
| Aspect | 🎯 Goal | 🚦Signals | 📈Metrics |
| Happiness | Increase overall user satisfaction. | User ratings on app stores, sentiment analysis of user reviews. | NPS: 75, Average App Store Rating: 4.7/5. |
| Engagement | Boost user interaction and time spent on the app. | Daily time spent on the app, frequency of content viewed. | DAU: 500,000, Avg. Session Duration: 45 mins, Content Views per User: 8. |
| Adoption | Encourage new users to sign up and explore content. | Number of new user registrations, completion of onboarding process. | New Accounts Created: 50,000, Onboarding Completion Rate: 70%. |
| Retention | Retain users over time and prevent app uninstalls. | Churn rate, user activity over weeks/months. | 7-day Retention Rate: 60%, 30-day Retention Rate: 45%, MAU: 300,000. |
| Task Success | Improve the efficiency of content discovery and playback. | User completion rates for watching shows, frequency of playback errors. | Content Playback Success Rate: 95%, Playback Error Rate: 2%, Time to Start Playback: 5 seconds. |
Why Use the HEART Framework?
- Comprehensive Evaluation: The HEART framework provides a holistic view of user experience by considering multiple dimensions. It goes beyond traditional metrics like clicks or page views and focuses on aspects that directly impact user satisfaction.
- User-Centered Focus: The metrics in the HEART framework are user-centered, emphasizing the importance of understanding and improving the user experience. This approach aligns with the user-centric philosophy of design and development.
- Actionable Insights: The framework aims to provide actionable insights for improvement. By focusing on happiness, engagement, adoption, retention, and task success, teams can identify specific areas that require attention and enhancement.
- Flexibility: The HEART framework is adaptable to different types of products and industries. Teams can customize the metrics based on the specific goals and nature of their product or feature.
Example Scenario:
Consider a mobile app that introduces a new chat feature. The HEART framework can be applied as follows:
Happiness: Measure user satisfaction through surveys or feedback mechanisms, asking users how satisfied they are with the new chat feature.
Engagement: Track the number of daily active users within the chat feature, the frequency of messages sent, and the time users spend in the chat.
Adoption: Monitor the rate at which users sign up or activate the new chat feature. Analyze how quickly users are adopting and integrating it into their communication patterns.
Retention: Assess the percentage of users who continue to use the chat feature over time. Identify factors influencing user retention.
Task Success: Evaluate the task success rate by measuring how effectively users can send and receive messages, attach files, or use other functionalities within the chat.
By using the HEART framework in this scenario, the development team can gain insights into the user experience of the new chat feature and identify areas for improvement based on user satisfaction, engagement patterns, adoption rates, retention, and task success metrics.
Real-World Examples of Product Metrics:
- Netflix: Netflix uses Churn Rate to assess how many subscribers cancel their memberships each month. By understanding why users churn, Netflix can make content and user experience improvements.
- Spotify: Spotify tracks Monthly Active Users (MAU) and measures user engagement by analyzing the number of daily streams per user. This data informs their personalized playlist recommendations.
- Amazon: Amazon calculates Customer Lifetime Value (CLV) to understand the long-term value of each customer. This informs their marketing strategies and customer retention efforts.
- Google: Google uses Click-Through Rate (CTR) to assess the effectiveness of its search ads. Higher CTR indicates that users are finding ads relevant.
- Airbnb: Airbnb collects Net Promoter Score (NPS) feedback from guests to gauge their satisfaction. High NPS scores correlate with repeat bookings.
📖 Recommended Books for Further Learning
- “Lean Analytics” by Alistair Croll and Benjamin Yoskovitz
- “Product Analytics: Applied Data Science Techniques for Actionable Consumer Insights” by Joanne Rodrigues and Ken Yale
- Designing with Data: Improving the User Experience with A/B Testing by Rochelle King, Elizabeth F. Churchill, & Caitlin Tan
Also, here is the list of the Top 20 Product Metrics that you must definitely look at!
🔔 Conclusion
In today’s highly competitive market, product analytics and metrics are indispensable tools for product managers. You can elevate your product management skills by understanding the types of metrics, mastering data analytics techniques, recognizing the hallmarks of good metrics, utilizing frameworks, and diving into recommended literature. Moreover, with the curated list of the top 20 product metrics, you now have a valuable reference to guide your data-driven decisions.
Remember, data is your ally, and harnessing its power can steer your product toward unprecedented success.
Quiz Time
Question: What is the primary purpose of quantitative metrics in product management?
A) Assess user loyalty
B) Evaluate user satisfaction
C) Measure financial health
D) Analyze customer sentiments
Question: Which data analysis technique focuses on making predictions about future trends based on historical data?
A) Descriptive Analytics
B) Predictive Analytics
C) Prescriptive Analytics
D) Diagnostic Analytics
Question: What is a characteristic of effective metrics?
A) Unreliable
B) Irrelevant
C) Inconsistent
D) Actionable
Question: In the AARRR framework, what does “Retention” measure?
A) Financial success
B) User engagement
C) User loyalty over time
D) Initial user experience
Question: Which component of the HEART framework focuses on the efficiency and effectiveness of users in completing specific tasks?
A) Happiness
B) Engagement
C) Adoption
D) Task Success
✍️ Write your answers in the comment section. e.g 1-a, 2-b, 3-c etc.
If you want to learn more about product management, you can also find other posts. The Full series is available here
💌 Do drop me a comment below if you found the content useful and/or want me to write on a specific topic. This will make my day! 🙂
Also, share the post if you think this might help someone. The sharing link is at the top of the page.
Join FreeMentor as a student if you are a newbie in product management and want to have one Free 1:1 mentorship session.
Disclaimer:
Please note that I don’t make any guarantees about the information supplied in this post. I share educational and informational resources that are intended to help you succeed in understanding product management. You nevertheless need to know that your ultimate success or failure will be the result of your own efforts, your particular situation, and innumerable other circumstances beyond my knowledge and control.
#ProductManagement #ProductAnalytics #DataAnalytics #Metrics #DataDrivenDecisions #LinkedInPost #ProductManager